BigPicture for Jira: a quick tutorial on Big Picture for Jira
Big Picture for Jira tutorial: learn how to access it, configure boxes and manage your project portfolio in Jira with a high-level view.
Big Picture in Project Portfolio Management
If you work with Jira, you know it's a great tool option for managing project activities.
When you start managing projects in Jira, it's common to need a global, structured view of your projects. Has that ever happened to you?
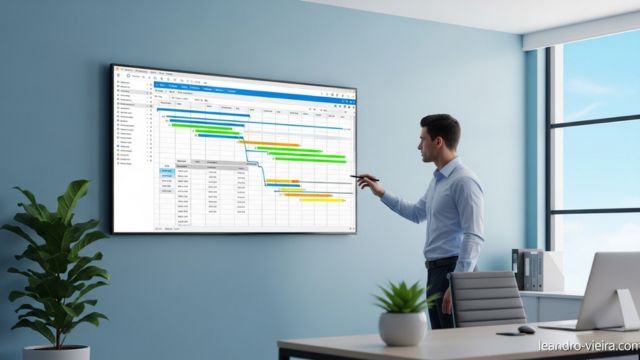
That's where BigPicture comes in (also known as Big Picture for Jira), a Jira plugin that, as the name suggests, gives you the "big picture" view of your projects and portfolios right inside the tool.
When I implemented it at a company I was consulting for, we put together a short tutorial, and I'm sharing it with you.
In this tutorial, I'll introduce BigPicture a bit more, showing you how to access it, understand its home screen and navigate its main features.
It's nothing too advanced, but it'll give you a good sense of what's possible and how things work in it, and maybe you'll see whether it fits your situation or not.
I hope this helps optimize your project and portfolio management in Jira!
TUTORIAL
How to access it: Follow the steps below to access it easily:
- Log in to JIRA and go to the "Apps" menu.
- Look for "Big Picture" and click it.
That gives you access to the entire Big Picture portfolio.

Another way to access Big Picture is through a specific Jira project:
- Open the project you want in JIRA.
- In the menu on the left, click "Big Picture."
The difference between the two methods is that accessing Big Picture through a specific project takes you to a screen dedicated to that project and its scope. Accessing it through the "Apps" menu, on the other hand, gives you access to every project in the organization.
Home:
Big Picture's home screen is called "Home," and it shows an overview of all projects and their respective scopes. Each project is represented by a "box," and that's where you define the project's scope.
Think of it this way: a project might include its own items, but also the items from a development team's board, for example.

Items from a "development team board" are treated as sub-items of the "Projects" issues. This setup is flexible and can be adapted to your needs.
Inside the "boxes," there's information worth noting, such as:

-
Start date: the project's start date.
-
End date: the project's end date.
-
Status: you can change the project's status.
-
To do that, click the "More actions" option, shown as three dots on the right side of the text.
-
Not started: indicates the project hasn't effectively started yet.
-
In progress: when the project is underway.
-
Closed: indicates all issues related to the project have been completed.
This information is essential for managing and tracking project progress in JIRA's Big Picture.
Also, during the "Not started" phase, you can review and refine the project's scope, set clear goals and objectives, assign responsibilities and plan the resources you'll need.
• Status (tasks): Within a scope (box), you have epics, stories and tasks, which can be in different statuses. These statuses are shown visually in JIRA's Big Picture and give you information about how activities are progressing.
Let's look at the main statuses:
- To do (gray): this status means the activity hasn't started yet. Shown in gray.
- In Progress (blue): when an activity is underway, it's marked as In Progress. This means the tasks are actively being worked on. Shown in blue.
- Done (green): when an activity is completed or canceled, it's marked as Done. This status means all related tasks have been successfully finished. Shown in green.
This information is displayed on the boxes in Big Picture and gives you an overview of how the project is progressing. For example, you might have 13% of activities in To Do, 10% in In Progress and 77% in Done.
These numbers reflect the proportion of activities in each status within the scope. Looking at this information, you can quickly understand how the project is going.
This information is valuable for assessing progress and spotting potential bottlenecks or areas that need attention.
By analyzing task statuses inside the boxes, you get an overview of the project and can take the right steps to move it forward. Big Picture in JIRA makes it easy to visualize this data and helps you manage projects efficiently.
In Big Picture, you can customize the display settings for fields. That includes the ability to remove or add new fields, depending on your project's specific needs. For example, if the description field isn't being used, you can remove it from the view to simplify the interface.
Menu:

Top menu: Big Picture has a top menu with several options to enhance the view and the user experience. Some of the available options are:
View: the system offers three view types for the boxes. These options are:
Timeline: shows activities on a timeline, letting you view projects and their tasks chronologically.
Gantt: shows activities in Gantt chart format, giving you a clear view of task dependencies and progress over time.
Kanban: a board-based view option that lets you track task workflow across different stages, such as "To Do," "In Progress" and "Done."
These view options let you pick the format best suited to tracking and managing projects within Big Picture, making the interface more flexible and adaptable to your team's preferences and needs.
Box
Option to add a new box: you can add a new box to represent a new scope or project. To do that, follow these steps:
Click the "+" sign or "Add" in the top menu.

Clicking "+" opens a window where you can enter the new box's type and name.
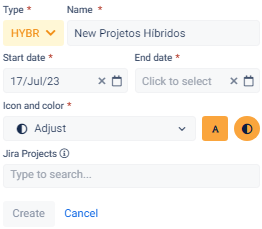
Available types:
Agile: suited for projects following an agile approach, like Scrum.
Ideal for teams that prefer an agile development framework.
Hybrid: this type of box works for projects that combine elements of agile and traditional methods. Useful when you need to adapt practices depending on the project's context.
Portfolio: this type of box is used to represent a portfolio of projects, letting you view the integration and interdependency between different projects at a higher level.
Program: this option fits projects that are part of a larger program. It lets you view and manage multiple related projects within a program structure.
Classic Projects: this type is meant for projects following a traditional project management approach, like the waterfall model. Useful for projects with well-defined requirements and a linear sequence of steps.
When adding a new box, you can choose the type that best fits the project and give it a name. This lets you organize and represent different types of projects within Big Picture, making it easier to visualize and manage according to your company's specific needs.
Dragging and organizing boxes:
when you drag one type of box inside another, you're establishing a hierarchy between them. That means the box you dragged inside becomes a sub-item of the parent box.

This hierarchy is useful for representing dependency relationships, grouping related projects or splitting a larger project into smaller parts.
Box type hierarchy:
Parent box: the parent box is the top level of the hierarchy. It can be any of the available types, such as Agile, Hybrid, Portfolio, Program or Classic Projects. This box represents a larger scope or a main project that contains other sub-items.
Child box (sub-item): a child box is a type of box that's been dragged and placed inside a parent box. It represents a sub-item or a specific part of a larger project. The sub-item can have its own type (for example, Agile or Hybrid) and name.
The box type hierarchy in Big Picture gives you a clearer, more organized view of how projects relate to each other, making it easier to manage and understand the project portfolio as a whole.
Configuration/Type Boxes:
To access this option, follow the steps below.
- Click the admin icon, located in the top-right corner of the screen. The admin icon looks like a screwdriver or a gear.
- In the dropdown menu that appears, select "Type Boxes."

Following these steps takes you to the box type configuration page, where you can customize and adjust the settings for existing box types or create new ones.

Box type configuration: you can configure box types according to your specific needs. This includes defining states and parent-type relationships. Just click an existing item or add a new one.
States: box states represent the different stages a project or scope can go through. For example, a state might be "In Progress," "Completed" or "Canceled." Configuring states lets you customize and adapt the terminology to your team's project management methodology.
Parent Type: this setting lets you define the parent-child relationships between box types. For example, a "Program" box type can be set as the parent of the "Portfolio" type. That means a "Program" box can be included as a sub-item within a "Portfolio" box. This setting gives you flexibility to structure and visualize the project hierarchy according to the relationships that actually exist between them.
To make these configurations, click inside the box you want to change, access the configuration options and make the needed changes. You can add new box types, modify states and define parent types, indicating which box types can be parents of a given type.
This custom box-type configuration in Big Picture gives you a quick, intuitive view within each box, reflecting the hierarchical relationships and making it easier to manage projects and their sub-items.

This configuration option lets you define the properties and characteristics of box types, including states, parent types and other related settings. It's a useful resource for adapting Big Picture to your team's and projects' specific needs.
Top menu / Configure layout: used to access customization and view configuration options.
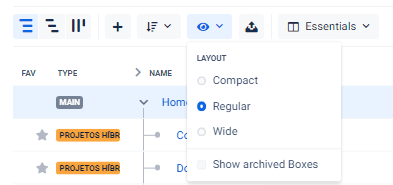
In the layout configuration options, you'll find different layout choices to adjust how elements are displayed on screen. Some common options include:
Compact layout: this layout option aims to optimize screen space by shrinking elements and making them more compact. With the compact layout, you can see more information in a smaller area, which can be useful on smaller screens or when you want a more condensed view.
Regular layout: the regular layout is a default setting that balances the space elements take up with the amount of information shown. It offers a balanced view and suits most needs, providing a comfortable viewing experience.
Wide layout: the wide layout is an option that widens the view, letting more elements be displayed side by side. This can be useful when you want a broader view of projects and details, especially on larger screens or when you need to analyze several pieces of information at once.
These layout options - compact, regular and wide - let you adjust the look and organization of elements on the Big Picture screen according to your visual preferences and how much information you want to see at once. Choosing the layout that fits your needs best can make for a more comfortable and efficient viewing experience when managing projects.
Top menu/Menu organization:
The system lets you organize information by fields or teams. That means you can configure the menu to display data based on specific criteria, such as priority field, status, assignee or any other custom field relevant to your projects.

Default "Essentials" field: often set as the menu's default layout. This means that when you access Big Picture, the menu will show the project's essential information, such as project name, start and end dates, overall status and other relevant information. The goal is to give a clear, concise overview of the project without overwhelming the user with too much detail.
Top menu / Favorite: lets users mark or highlight specific items for quick access later.
Top menu / Filters: this option lets you create custom filters based on different criteria, such as: type, leader, start date, end date and status. These filters are useful for narrowing down and viewing only the information relevant to your specific needs.
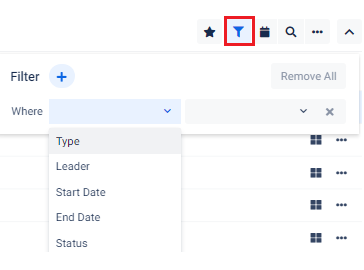
Filters:
Type: the type filter lets you select one or more item types you want to view. For example, you can filter items by project type, such as Agile, Hybrid, Portfolio, Program or Classic Projects. This lets you focus only on the project types relevant to you.
Leader: the leader filter lets you filter items based on the leader responsible for them. You can select a specific leader or several leaders to view only the projects assigned to them. This is useful for tracking a team's or a specific leader's projects.
Start date and End date: the start date and end date filters let you filter items based on a specific date range. You can set a time window to view only the projects scheduled to start or end within that range. This helps prioritize and track projects within certain periods.
Status: the status filter lets you select one or more specific statuses to view only the projects with those statuses. For example, you can filter to see only projects that are in progress, completed or canceled. This makes it easier to track project progress based on its current status.
Top Menu:
Top menu / date range: you can search within a specific date range. This option generally lets you filter projects based on a date range.

Top menu / Search: lets you find specific projects, items or information based on keywords or search criteria. This option is useful for quickly locating relevant items within the system.

Accessing a Box: When you access a specific box, such as the Projects board, you get a more detailed, specific view of the items and information inside that box.

Box information: opening the "Projects" box shows relevant information tied to that specific scope. This can include the box's name, start and end dates, current status and other relevant information.
Item hierarchy: inside the box, you'll see the hierarchy of items that make up "Projects." This can include epics, stories, tasks or other work items. These items are organized hierarchically, with epics at the top and stories and tasks below.
Item status: each item inside the box has a status attached to it, showing what stage of completion it's in. This can be shown as colors or labels, like "To Do," "In Progress" or "Done." These statuses let you track the progress and current state of each item.
Progress percentage: inside the box, it's common to find a view of the overall progress percentage for "Projects." This might be shown as a bar or a number, indicating the percentage of items in each status. For example, you might see that 40% of tasks are "To Do," 30% are "In Progress" and 30% are "Done." This information gives you a quick sense of how the box as a whole is progressing.
Item details: clicking a specific item inside the box gives you access to that item's details. This can include additional information, like description, assignees, specific dates, attachments and comments. These details give you a deeper view of each item, letting you manage and track tasks more precisely.
The view inside a box in Big Picture is designed to give you clear, organized information about specific items and scopes. It lets you track progress, view the item hierarchy and access the details you need to manage projects efficiently.
Gantt menu/Settings: the Gantt menu lets you access settings related to viewing and customizing the Gantt chart. A Gantt chart is a visual representation showing project tasks over time, letting you track the schedule and manage workflow. Here's some information about the settings available in the Gantt menu:
Display settings: inside the Gantt menu, you'll find options to customize how the Gantt chart is displayed. This can include scale adjustments, date formatting, grid lines, hiding or showing specific details, and more. These settings let you adapt the Gantt chart to your visual preferences and the project's needs.
Grouping and sorting: the Gantt menu may also have settings related to grouping and sorting tasks. This lets you group tasks by specific criteria, such as assignee, priority, type or any other relevant field. You can also set the order tasks are displayed in on the Gantt chart, making sure they're organized the best way for viewing and analysis.
Filters: the filter settings in the Gantt menu let you set filtering criteria to show only tasks that meet certain conditions. For example, you can filter by a specific date range, assignee, status or other custom fields. This helps you focus on viewing the tasks relevant to the moment or to specific analyses.

Color and style customization: the Gantt menu may offer options to customize the colors and styles used in the Gantt chart. This lets you visually highlight different task types, mark important milestones, call out critical tasks or apply other color schemes relevant to your project or visual preferences.
Well, those are the standard Big Picture features and menus we've covered. Menus and items may vary depending on the plan and the platform's current version, but overall, it doesn't stray far from what's shown here.
Conclusion
In a world where the need for a strategic, portfolio-level view keeps growing, BigPicture is an option for Jira users. This tutorial covered a few sides of the plugin, from the intuitive ways to access it and understanding the "Boxes" structure on the "Home" screen, to customization and viewing options, like Gantt charts.
BigPicture's ability to unify project and portfolio management, offering both the micro view of tasks and the macro view of the strategic picture, is a significant differentiator. In this article, I cover how to build collaboration on your team, which is essential for anyone looking to roll out platforms like Big Picture. If you're structuring this service from scratch in your PMO, this practical guide to structuring an IT project portfolio is a good next step.
The hierarchical box structure, customization and advanced filtering give teams the power to adapt the tool to their specific practices, ensuring more control, transparency and efficiency.
So, for technology professionals looking to optimize how they manage their projects and programs in Jira, BigPicture is worth considering. It becomes a strategic tool for project managers, giving them the visibility that drives decision-making and the success of organizational initiatives.
Rolling it out lets you track things in detail and manage proactively, in line with your business objectives. If you'd like to implement it at your company, leave a comment below, I'd be glad to hear from you and help out.
Send this article to that colleague who works with project portfolios, share this post.
Take care,